Kansas City Violent Crime Data: Mayor Quinton Lucas, KCPD Homicide Numbers, and Public Safety Accountability
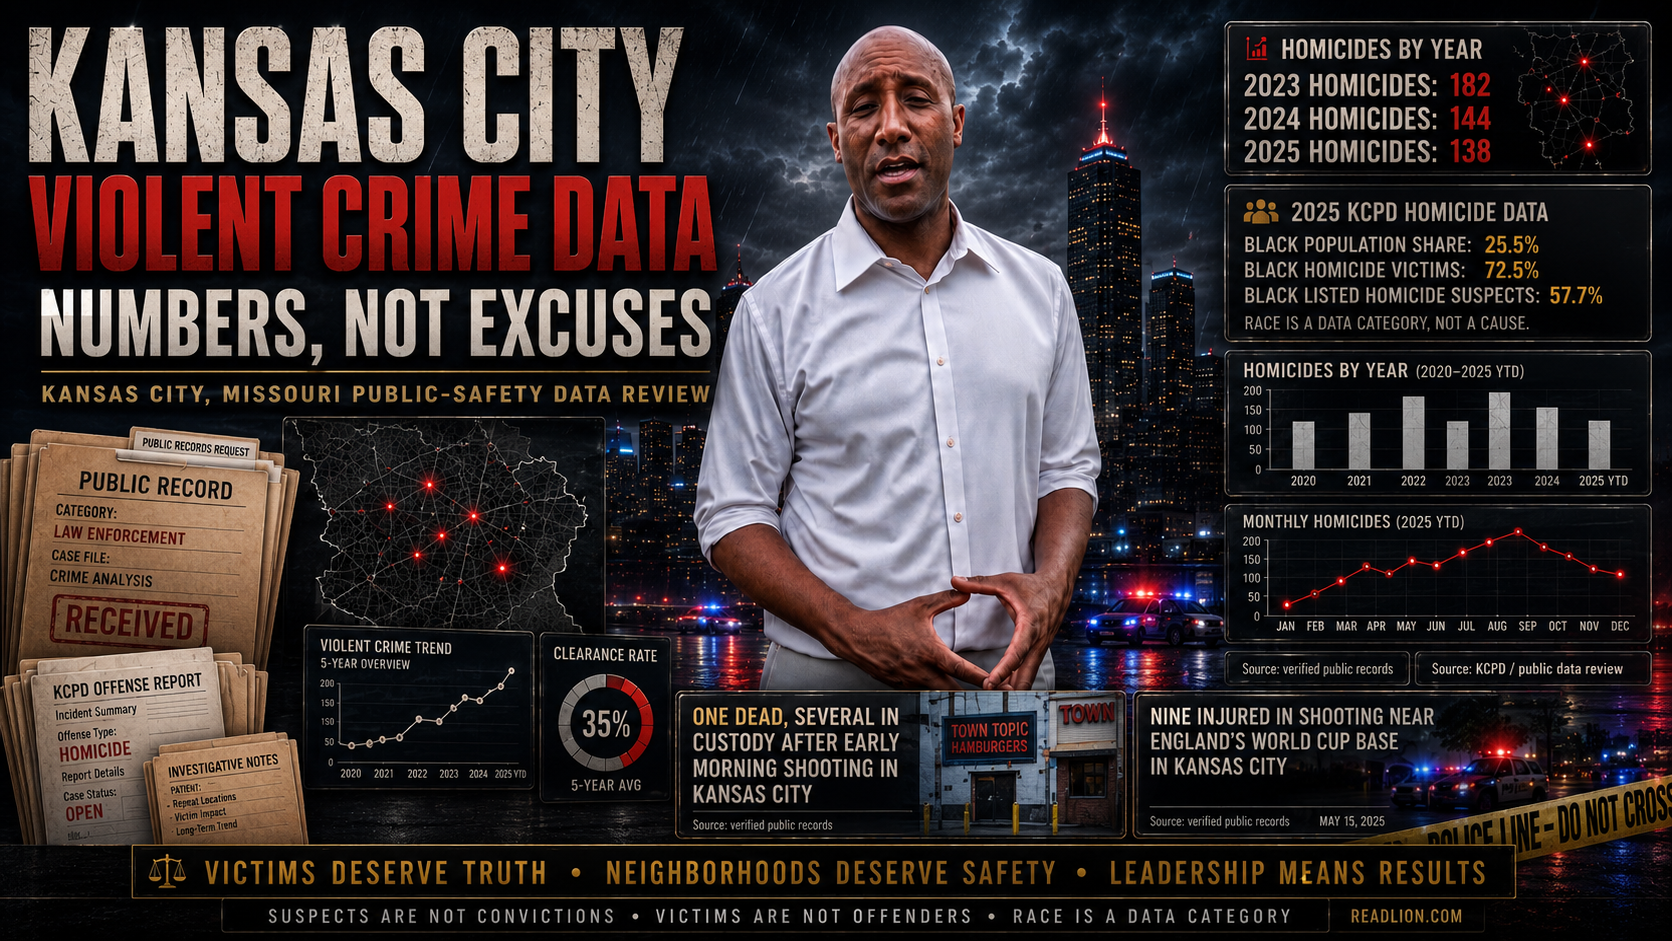
Kansas City Violent Crime by Race: What Official KCPD, Census, FBI, and BJS Data Actually Show
Kansas City cannot fix violent crime by refusing to look directly at the numbers.
This article uses race only as an official reporting category because KCPD, the U.S. Census Bureau, the FBI, and the Bureau of Justice Statistics report public data that way. Race is a reporting category here, not an explanation.
The point is simple. When official records show one population group is a smaller share of the city population but a much larger share of homicide victims and KCPD-listed homicide suspects, the public deserves to see that data clearly.
Kansas City does not need slogans. Kansas City needs public-safety numbers, transparent dashboards, and leaders willing to deal with uncomfortable facts.
That includes Mayor Quinton Lucas.
Lucas is not the police chief, prosecutor, or judge. He did not personally commit violent crime. But he is the mayor of Kansas City, and the mayor is also the fifth member of the Kansas City Board of Police Commissioners. Public safety is part of his record.
The victims deserve truth.
The neighborhoods deserve safety.
The public deserves numbers, not excuses.
Kansas City’s Homicide Reality
KCPD’s final homicide reports show Kansas City recorded:
Year KCPD homicide count
2023 182
2024 144
2025 138
Sources: KCPD 2023 Final Daily Homicide Analysis, KCPD 2024 Final Daily Homicide Analysis, and KCPD 2025 Daily Homicide Analysis.
KCPD notes that officer-involved shootings are not included in these homicide totals.
Yes, homicides dropped from 182 in 2023 to 144 in 2024, then to 138 in 2025. That decline matters. But 138 homicides is still a serious public-safety crisis for any city.
A lower number does not mean the problem is solved.
KCPD also reported that in 2025, compared with 2024, homicides fell 5%, nonfatal shootings fell 31%, and robberies fell 27%. Source: KCPD, Crime In Kansas City Fell Significantly in 2025.
Progress is not the same as accountability. Kansas City still has to explain who is being harmed, where violence is concentrated, who police are identifying as suspects, what cases are being filed, and what happens after those cases reach prosecutors.
Kansas City Population by Race and Ethnicity
The U.S. Census Bureau QuickFacts page lists Kansas City’s estimated 2025 population at 521,220.
Census QuickFacts lists Kansas City’s racial and ethnic makeup as:
Category Kansas City percentage
White alone 56.5%
Black alone 25.5%
American Indian and Alaska Native alone 0.4%
Asian alone 2.9%
Native Hawaiian and Other Pacific Islander alone 0.2%
Two or more races 9.9%
Hispanic or Latino, any race 12.5%
White alone, not Hispanic or Latino 54.0%
Source: U.S. Census Bureau QuickFacts, Kansas City city, Missouri.
KCPD Homicide Victims by Race
KCPD’s final homicide reports show Black victims were the largest listed race category among Kansas City homicide victims in 2023, 2024, and 2025.
Year Total homicide victims Black victims White victims Hispanic victims Other / Asian / Unknown
2023 182 134 30 16 2
2024 144 107 30 7 0
2025 138 100 32 6 0
Sources: KCPD 2023 Final Daily Homicide Analysis, KCPD 2024 Final Daily Homicide Analysis, and KCPD 2025 Daily Homicide Analysis.
Victim data is not offender data. It shows who was killed.
But the victim data is still brutal.
In 2025, Black residents were about 25.5% of Kansas City’s population, but Black victims were 100 of 138 homicide victims, or 72.5%.
That is an overrepresentation ratio of about 2.84x.
72.5 ÷ 25.5 = 2.84
That means Black Kansas Citians were listed as homicide victims at nearly three times their share of the city population.
Ignoring that data does not protect anyone. It hides the victim reality.
KCPD Homicide Suspects by Race
KCPD’s final homicide reports also list homicide suspects by race and gender.
A suspect is not a conviction.
A suspect is not proof of guilt.
Suspect data reflects who KCPD listed as a suspect in homicide cases.
KCPD also warns that victim and suspect totals may not match because homicide cases can involve multiple victims, multiple suspects, or both.
Year Total listed suspects Black suspects White suspects Hispanic suspects Asian suspects Other suspects
2023 202 118 19 15 1 49
2024 156 103 15 7 0 31
2025 137 79 19 6 0 33
Sources: KCPD 2023 Final Daily Homicide Analysis, KCPD 2024 Final Daily Homicide Analysis, and KCPD 2025 Daily Homicide Analysis.
In 2025, Black suspects were 79 of 137 KCPD-listed homicide suspects, or 57.7%.
Black residents were about 25.5% of the city population.
That is an overrepresentation ratio of about 2.26x.
57.7 ÷ 25.5 = 2.26
That is not a conviction claim. It is not an all-crime claim. It is a KCPD homicide suspect data claim.
Victims and Suspects Must Stay Separate
Kansas City’s crime debate becomes useless when people mix categories.
Victims are people harmed or killed.
Suspects are people police identify in connection with a case.
Arrests are people taken into custody.
Convictions require court outcomes.
KCPD homicide victim data shows who was killed.
KCPD homicide suspect data shows who police listed as suspects.
FBI arrest data shows arrests, not convictions.
BJS homicide victimization data shows victimization, not suspects or guilt.
Those categories cannot be swapped.
Kansas City Overrepresentation Table
Year Category Group Event share Population benchmark Overrepresentation ratio
2025 Homicide victims Black 72.5% 25.5% 2.84x
2025 Homicide suspects Black 57.7% 25.5% 2.26x
2024 Homicide victims Black 74.3% 25.5% 2.91x
2024 Homicide suspects Black 66.0% 25.5% 2.59x
2023 Homicide victims Black 73.6% 25.5% 2.89x
2023 Homicide suspects Black 58.4% 25.5% 2.29x
Sources: KCPD final homicide reports and U.S. Census Bureau QuickFacts, Kansas City city, Missouri.
Overrepresentation ratio means event share divided by population share. It does not prove conviction, motive, guilt, or explanation. It only measures how far a group’s share of a listed category differs from its share of the population.
Approximate Kansas City Homicide Victim Rates by Group
These rates are approximate because KCPD and Census categories do not line up perfectly. Census reports race and Hispanic origin separately. KCPD’s homicide table lists Hispanic separately.
Using the Census QuickFacts 2025 population estimate of 521,220:
Black alone population estimate:
25.5% of 521,220 = about 132,911 people.
White alone, not Hispanic or Latino population estimate:
54.0% of 521,220 = about 281,459 people.
Hispanic or Latino, any race population estimate:
12.5% of 521,220 = about 65,153 people.
Group 2025 homicide victims Approx. population benchmark Approx. homicide victim rate per 100,000
Black 100 132,911 75.2
White, non-Hispanic benchmark 32 281,459 11.4
Hispanic, any race benchmark 6 65,153 9.2
Sources: KCPD 2025 Daily Homicide Analysis and U.S. Census Bureau QuickFacts, Kansas City city, Missouri.
This is victimization data. It is not suspect data. It is not conviction data.
But it shows who is being killed at the highest rate.
The Mayor Lucas Leadership Problem
Kansas City’s violent-crime problem did not happen in a vacuum, and City Hall does not get to act like public safety is somebody else’s problem.
Quinton Lucas is the mayor of Kansas City. Source: City of Kansas City official Mayor Quinton Lucas page.
The Kansas City Board of Police Commissioners page says the board is responsible for providing police service to Kansas City residents and that the fifth member of the board is the mayor of Kansas City. Source: KCPD Board of Police Commissioners.
That does not mean Mayor Lucas personally controls every police decision. It does not mean he controls every prosecutor decision, every court outcome, or every act of violence.
But it does mean he is not a bystander.
He is the mayor.
He holds a seat on the police board.
He is one of the most visible public-safety leaders in Kansas City.
That makes public safety part of his record.
The official data shows Kansas City had 182 homicides in 2023, 144 in 2024, and 138 in 2025. The official data also shows Black Kansas Citians are far above their population share among homicide victims and KCPD-listed homicide suspects.
A serious mayor would put that data in front of the public every month.
A serious mayor would demand a dashboard showing homicide victims, homicide suspects, nonfatal shootings, robberies, aggravated assaults, repeat violent offenders, illegal gun cases, juvenile violent crime, case filings, dismissals, pleas, convictions, and clearance rates.
A serious mayor would stop letting residents dig through PDFs to understand who is being killed and what the system is doing about it.
Mayor Lucas cannot claim the image of Kansas City when it is convenient and then act like the city’s public-safety crisis belongs to someone else when the numbers are ugly.
Leadership means owning the hard numbers.
Leadership means telling the truth even when the truth makes City Hall uncomfortable.
Leadership means measuring results, not hiding behind speeches.
Kansas City does not need another press conference. Kansas City needs a mayor who treats public safety as the first job of city government.
Missouri Statewide Comparison
Missouri’s violent-crime rate is also above the national rate.
The Bureau of Justice Statistics’ 2024 Crime Known to Law Enforcement report estimated Missouri’s violent-crime count at 29,440 and Missouri’s violent-crime rate at 471.5 per 100,000.
BJS estimated Missouri’s 2024 violent-crime offense categories as:
Missouri offense category 2024 estimated count 2024 rate per 100,000
Homicide 490 7.9
Rape 3,030 48.5
Robbery 3,250 52.1
Aggravated assault 22,670 363.1
Total violent crime 29,440 471.5
Source: BJS Crime Known to Law Enforcement, 2024.
Missouri’s population makeup is different from Kansas City’s. Census QuickFacts lists Missouri as:
Category Missouri percentage
White alone 82.1%
Black or African American alone 11.7%
Hispanic or Latino, any race 5.6%
White alone, not Hispanic or Latino 77.3%
Source: U.S. Census Bureau QuickFacts, Missouri.
National Comparison
The FBI reported that national violent crime decreased in 2024.
According to the FBI, more than 16,000 law enforcement agencies covering 95.6% of the U.S. population submitted data to the FBI’s Uniform Crime Reporting Program for 2024. The FBI reported that violent crime decreased an estimated 4.5% from 2023 to 2024.
Source: FBI Releases 2024 Reported Crimes in the Nation Statistics.
The FBI’s 2024 UCR Summary states that violent crime includes murder and nonnegligent manslaughter, rape, robbery, and aggravated assault. The FBI summary estimated:
National category 2024 estimate
Violent-crime offenses 1,221,345
Violent-crime rate 359.1 per 100,000
Violent-crime arrests 419,423
Source: FBI UCR Summary of Reported Crimes in the Nation, 2024.
BJS national homicide victimization data shows a sharp victimization gap by race category.
In 2023, BJS estimated:
Race of homicide victim Estimated victims Homicide victimization rate per 100,000
Black 11,060 21.3
White 8,070 3.2
Asian 370 1.4
American Indian or Alaska Native 250 4.2
Native Hawaiian or Other Pacific Islander 50 6.5
Source: BJS Homicide Victimization in the United States, 2023.
Again, this is victimization data. It does not identify suspects. It does not prove convictions. It shows who was killed.
What Kansas City Leaders Should Publish Every Month
Kansas City officials should not be allowed to speak vaguely about public safety while the public has to dig through PDFs and scattered reports to understand what is happening.
A serious public-safety dashboard should show, every month:
Homicide victims by race, age, sex, and location.
Homicide suspects by race, age, sex, and location.
Nonfatal shooting victims by race and location.
Nonfatal shooting suspects or arrests by race and location.
Robbery arrests by race.
Aggravated-assault arrests by race.
Repeat violent-offender data.
Illegal gun case data.
Juvenile violent-crime data.
Case filings.
Case dismissals.
Plea outcomes.
Conviction outcomes.
Clearance rates.
Violent-crime hot spots.
Police deployment by violent-crime concentration.
Kansas City cannot keep asking the public to trust press conferences. The public deserves live numbers.
If the same neighborhoods are carrying the highest victimization burden, say it.
If the same categories are overrepresented in KCPD-listed suspects, say it.
If prosecutors are dismissing violent cases, publish it.
If repeat offenders are driving violence, publish it.
If illegal guns are tied to repeat violence, publish it.
No more slogans.
No more soft language.
No more hiding the data.
Conclusion
Kansas City cannot fix violent crime by avoiding the numbers.
KCPD’s own homicide reports show Black Kansas Citians are a much smaller share of the population than their share of homicide victims and KCPD-listed homicide suspects. That fact must be stated carefully, but it must be stated.
Victims are not suspects.
Suspects are not convictions.
Arrests are not convictions.
Population share is not guilt.
But overrepresentation is real when the numbers show it.
Mayor Quinton Lucas does not get blamed for every violent crime in Kansas City. But as mayor and as a member of the Kansas City Board of Police Commissioners, he can absolutely be judged for leadership, transparency, urgency, and public accountability.
The victims deserve truth.
Neighborhoods deserve safety.
The public deserves official data, not excuses.