6 Mayors, One Pattern: Crime, Debt & Broken Accountability
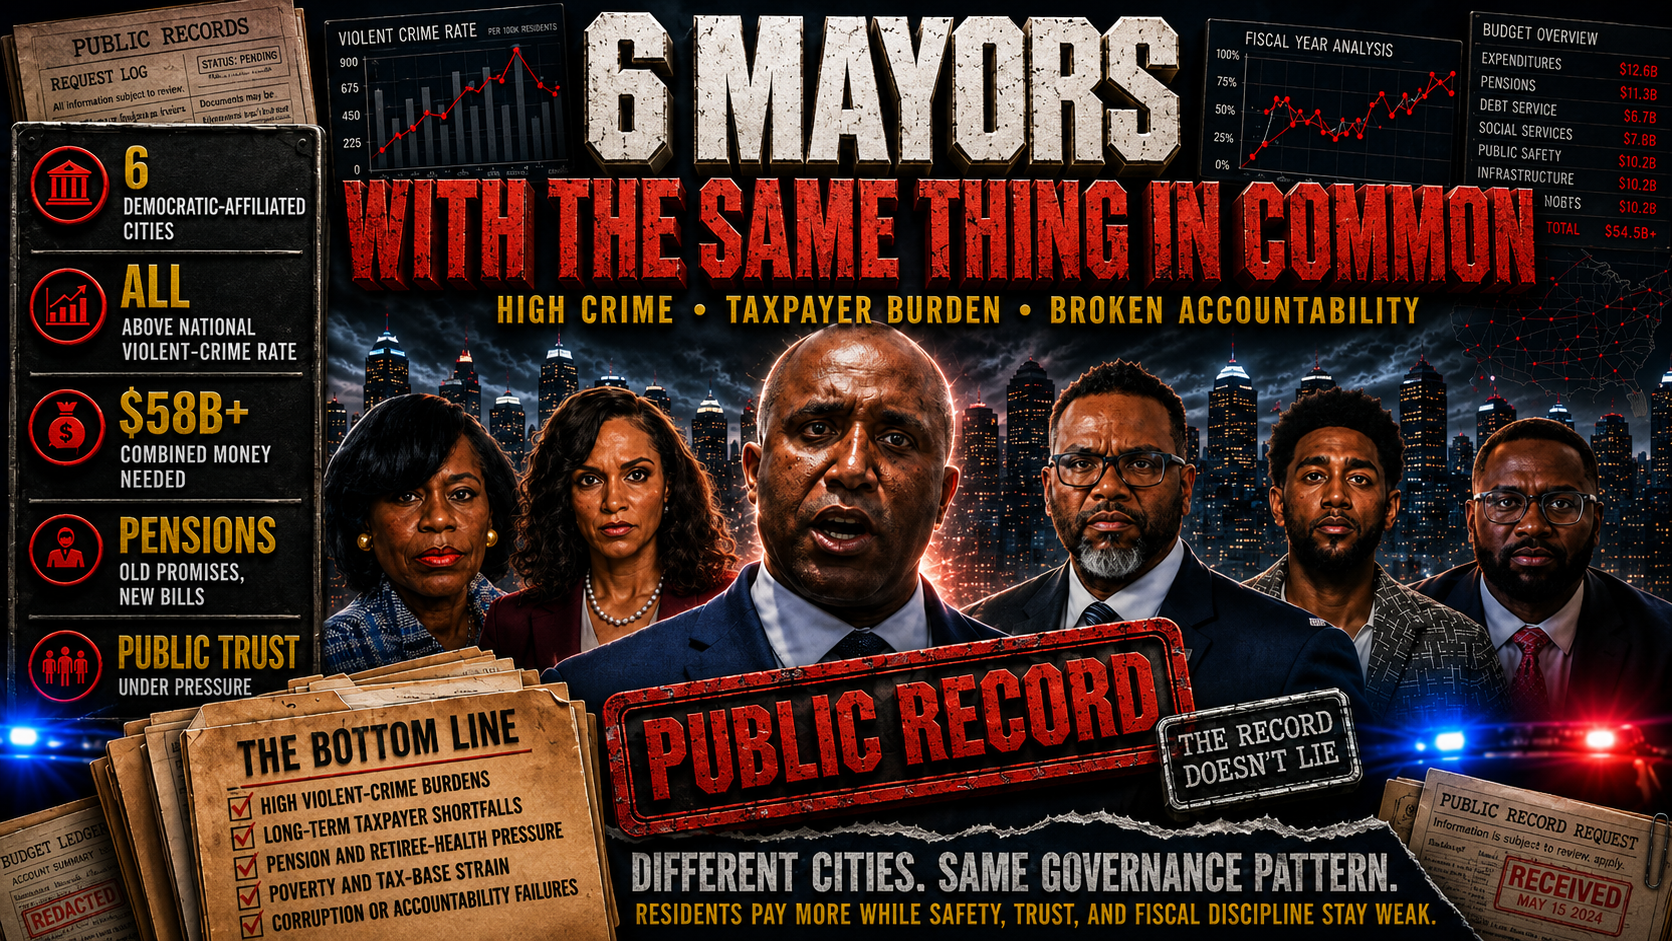
6 Mayors With the Same Thing in Common: Crime, Debt, and Broken Accountability
America’s urban-governance crisis does not need exaggeration. The public record is already bad enough.
Kansas City, Memphis, Baltimore, Detroit, Chicago, and Philadelphia are different cities with different histories. But the records show the same broad pattern: violent-crime rates far above the national benchmark, long-term taxpayer burdens, pension and retiree-health liabilities, poverty and tax-base stress, police-accountability conflicts, and documented corruption or local-government fraud cases.
The issue is not one mayor, one race, or one election cycle.
The issue is a governing model that asks residents to carry higher costs while safety, trust, and fiscal discipline remain weak.
Kansas City deserves special attention because Mayor Quinton Lucas has built a national political brand around public safety, criminal-justice leadership, and Democratic mayoral governance. Kansas City’s own official website says Lucas serves as the city’s 55th mayor and identifies public safety as part of his policy portfolio. It also says he serves as national chair for criminal-justice efforts in the United States Conference of Mayors and as co-chair of Mayors Against Illegal Guns.
Source: https://www.kcmo.gov/city-hall/city-officials/mayor-quinton-lucas
In January 2026, Kansas City announced that Lucas had been appointed president of the Democratic Mayors Association, an organization representing Democratic mayors. The same city announcement quoted Lucas saying Democratic mayors are delivering “historic crime reductions.”
Source: https://www.kcmo.gov/Home/Components/News/News/2902/231
That is the public-relations version.
The data version is much harder to defend.
## The Six-City Record
The pattern is easier to see when the numbers are not buried in a spreadsheet.
The FBI reported a 2024 national violent-crime rate of 359.1 per 100,000 people.
Source: https://cde.ucr.cjis.gov/LATEST/resources/reports/UCR%20Summary%20of%20Reported%20Crimes%20in%20the%20Nation%202024.pdf
Every city reviewed here remained far above that national benchmark based on Major Cities Chiefs Association violent-crime totals and 2024 Census population estimates.
Kansas City, Missouri had 8,033 violent crimes in 2024 and 6,925 in 2025. Its approximate 2025 violent-crime rate was 1,342 per 100,000 people, with 138 murders reported in 2025. Truth in Accounting reported that Kansas City needed $1.6 billion to cover its bills, equal to an $8,800 taxpayer burden. Its poverty rate was 14.6 percent.
Memphis, Tennessee had 8,270 violent crimes in 2024 and 7,749 in 2025. Its approximate 2025 violent-crime rate was 1,268 per 100,000 people, with 184 murders reported in 2025. Truth in Accounting reported that Memphis needed $2.0 billion to cover its bills, equal to a $9,100 taxpayer burden. Its poverty rate was 23.1 percent.
Baltimore, Maryland had 9,247 violent crimes in 2024 and 7,627 in 2025. Its approximate 2025 violent-crime rate was 1,342 per 100,000 people, with 133 murders reported in 2025. Truth in Accounting reported that Baltimore needed $3.2 billion to cover its bills, equal to a $14,400 taxpayer burden. Its poverty rate was 19.7 percent.
Detroit, Michigan had 11,903 violent crimes in 2024 and 10,692 in 2025. Its approximate 2025 violent-crime rate was 1,656 per 100,000 people, the highest rate in this six-city comparison. Detroit reported 165 murders in 2025. Truth in Accounting reported that Detroit needed $381.8 million to cover its bills, equal to a $1,600 taxpayer burden. Its poverty rate was 32.7 percent, the highest in the group.
Chicago, Illinois had 29,812 violent crimes in 2024 and 23,059 in 2025. Its approximate 2025 violent-crime rate was 847 per 100,000 people, with 417 murders reported in 2025. Truth in Accounting reported that Chicago needed $40.9 billion to cover its bills, equal to a $40,600 taxpayer burden. That was by far the largest fiscal burden in this comparison. Its poverty rate was 16.8 percent.
Philadelphia, Pennsylvania had 13,124 violent crimes in 2024 and 12,766 in 2025. Its approximate 2025 violent-crime rate was 811 per 100,000 people, with 220 murders reported in 2025. Truth in Accounting reported that Philadelphia needed $10.3 billion to cover its bills, equal to a $17,300 taxpayer burden. Its poverty rate was 21.4 percent.
Crime totals are calculated from the Major Cities Chiefs Association’s 2025 and 2024 year-end agency rows for homicide, rape, robbery, and aggravated assault. MCCA labels the data preliminary and not a final UCR/NIBRS report.
Source: https://majorcitieschiefs.com/wp-content/uploads/2026/02/MCCA-Violent-Crime-Report-2025-and-2024-Year-End.pdf
Population and poverty figures come from U.S. Census Bureau QuickFacts.
Source: https://www.census.gov/quickfacts/fact/table/memphiscitytennessee,baltimorecitymaryland,detroitcitymichigan,chicagocityillinois,philadelphiacitypennsylvania,kansascitycitymissouri/PST045224
Fiscal figures come from Truth in Accounting’s Financial State of the Cities 2025 report, based on FY2023 audited financial reports and retirement-plan reports.
Source: https://www.truthinaccounting.org/library/doclib/Financial-State-of-the-Cities-2025.pdf
The honest conclusion is not that crime is rising everywhere. Major Cities Chiefs Association data shows violent-crime totals declined from 2024 to 2025 across all six cities.
The stronger point is that even after those declines, every city remained far above the national violent-crime benchmark.
The fiscal picture follows the same pattern. These cities are not just dealing with annual budget fights. They are carrying accumulated obligations: old pension promises, retiree-health costs, and long-term bills that taxpayers are expected to absorb.
Combined, the six cities had more than $58 billion in money needed to cover bills, according to Truth in Accounting’s 2025 city report.
That is the story.
Not one bad year.
Not one bad mayor.
Not one isolated scandal.
A repeated urban-governance pattern: high public cost, high public risk, and weak public confidence.
## Crime Is Down. That Does Not Make These Cities Safe.
The honest argument is not that crime rose everywhere.
It did not.
MCCA’s preliminary agency data shows violent-crime totals declined from 2024 to 2025 across all six cities.
Kansas City dropped from 8,033 violent crimes to 6,925.
Memphis dropped from 8,270 to 7,749.
Baltimore dropped from 9,247 to 7,627.
Detroit dropped from 11,903 to 10,692.
Chicago dropped from 29,812 to 23,059.
Philadelphia dropped from 13,124 to 12,766.
But “down” is not the same as “acceptable.”
The FBI’s 2024 national violent-crime rate was 359.1 per 100,000 people. Kansas City’s approximate 2025 violent-crime rate was about 1,342 per 100,000. Detroit’s was about 1,656. Baltimore’s was about 1,342. Memphis was about 1,268. Chicago was about 847. Philadelphia was about 811.
So the issue is not that every number is moving in the wrong direction.
The issue is that these cities remain deeply unsafe compared with the national baseline even after declines.
A smaller fire is still a fire.
## Kansas City: Mayor Lucas’s Public-Safety Brand Collides With Kansas City’s Reality
Kansas City is the sharpest case because the facts cut straight through the branding.
Mayor Quinton Lucas is not merely a local mayor. Kansas City’s own announcement says he was appointed president of the Democratic Mayors Association, the national organization representing Democratic mayors of cities with populations of 30,000 or more. The same city announcement says his appointment runs through August 2027.
Source: https://www.kcmo.gov/Home/Components/News/News/2902/231
That matters because Lucas is now a national messenger for Democratic city governance while his own city remains a high-crime, fiscally strained municipality.
MCCA counted 145 Kansas City homicides in 2024 and 138 in 2025.
It counted 373 rapes in 2024 and 349 in 2025.
It counted 1,301 robberies in 2024 and 1,006 in 2025.
It counted 6,214 aggravated assaults in 2024 and 5,438 in 2025.
Add the 2025 categories together and Kansas City still had 6,925 violent crimes.
Source: https://majorcitieschiefs.com/wp-content/uploads/2026/02/MCCA-Violent-Crime-Report-2025-and-2024-Year-End.pdf
That is not a public-safety success story.
That is a city still bleeding at a rate far above the national benchmark.
Lucas can point to improvement.
He cannot point to normalcy.
Kansas City’s fiscal record also undercuts the image of competent city management. Truth in Accounting reported that Kansas City needed $1.6 billion to cover its bills and carried an $8,800 taxpayer burden. TIA gave Kansas City a “D” grade and classified it as a Sinkhole City.
Source: https://www.truthinaccounting.org/library/doclib/Financial-State-of-the-Cities-2025.pdf
TIA also said Kansas City reported an operating surplus, but rising unfunded pension liabilities reduced available funds, with two of the city’s three pension systems facing strain from unrealized investment losses and actuarial adjustments.
This is where Lucas looks worst: his national brand is about competent Democratic mayoral leadership, but his city’s record shows high violent crime, a taxpayer burden, pension pressure, and fragmented accountability.
To be precise, Kansas City is not like every other city in this comparison.
The Kansas City Board of Police Commissioners is responsible for providing police service under Missouri statute. The governor appoints four Kansas City residents to the board with state Senate consent, and the mayor is the fifth member.
Source: https://kcpolice.org/about/board-of-police-commissioners/
That means it would be inaccurate to say Lucas fully controls the police department.
But that defense does not save him.
It creates a different indictment.
If Lucas does not fully control policing, then Kansas City residents are stuck in an accountability structure where the mayor can campaign on safety, sit on the police board, lead national Democratic mayoral messaging, and still point to state control when outcomes are bad.
That is not clean governance.
That is accountability fog.
Kansas City also has documented local-government fraud in the federal record. In 2020, six Kansas City public works employees pleaded guilty in a nearly three-year conspiracy to collect $58,000 in fraudulent overtime pay.
DOJ said the defendants admitted to calling in damaged signs after hours, calling in signs that were not damaged, having friends and relatives make calls, and submitting false work orders and timesheets.
DOJ also said city managers found about 75 percent of callouts reviewed during the internal investigation were fraudulent before the city reported the matter to the FBI.
Source: https://www.justice.gov/usao-wdmo/pr/six-kcmo-employees-plead-guilty-58000-overtime-pay-fraud-scheme
That is not a personal corruption case against Lucas.
It is city-government fraud.
But it belongs in the accountability record because it shows the same basic problem: residents pay for government, and government systems fail to protect the public purse.
## The Fiscal Pattern: These Cities Are Paying for Yesterday’s Promises
Truth in Accounting’s taxpayer burden is not an annual budget deficit.
It is TIA’s estimate of how much each taxpayer would need to contribute if the city paid off accumulated debt. TIA explains that taxpayer burden represents the amount of money each taxpayer would need to contribute if the city paid off all accumulated debt. Cities without enough resources to cover obligations are classified as Sinkhole Cities.
Source: https://www.truthinaccounting.org/library/doclib/Financial-State-of-the-Cities-2025.pdf
That distinction matters.
The argument is not that Kansas City, Memphis, Baltimore, Detroit, Chicago, and Philadelphia each ran annual deficits equal to the listed burden.
The argument is that they carry long-term bills that current and future taxpayers are expected to absorb.
Kansas City had a $1.6 billion shortfall and an $8,800 taxpayer burden.
Memphis had a $2.0 billion shortfall and a $9,100 taxpayer burden, with TIA citing pension investment losses and rising retiree-healthcare costs.
Baltimore had a $3.2 billion shortfall and a $14,400 taxpayer burden, with TIA saying expenses exceeded revenues by about $179 million and pension debt grew.
Detroit improved relative to the others but still needed $381.8 million to pay bills and carried a $1,600 taxpayer burden.
Chicago was the disaster case: $40.9 billion needed to pay bills, a $40,600 taxpayer burden, an “F” grade, and pension debt identified as a major factor.
Philadelphia still needed $10.3 billion to cover bills and carried a $17,300 taxpayer burden.
The pattern is not mysterious.
These cities made promises faster than they funded them.
Pension and retiree-health obligations are not abstract accounting entries.
They are political decisions turned into taxpayer liabilities.
## Poverty Makes the Job Harder. It Does Not Excuse Failure.
Poverty matters because it affects the tax base, service demand, public safety, housing stress, and long-term fiscal stability.
Census QuickFacts 2020–2024 estimates show Detroit at 32.7 percent poverty, Memphis at 23.1 percent, Philadelphia at 21.4 percent, Baltimore at 19.7 percent, Chicago at 16.8 percent, and Kansas City at 14.6 percent.
Source: https://www.census.gov/quickfacts/fact/table/memphiscitytennessee,baltimorecitymaryland,detroitcitymichigan,chicagocityillinois,philadelphiacitypennsylvania,kansascitycitymissouri/PST045224
That context should be included because it keeps the argument honest.
High-poverty cities are harder to govern.
But poverty is not a license for weak management.
Poor residents deserve safe streets.
Poor residents deserve honest budgets.
Poor residents deserve basic services that work.
Poor residents deserve police systems that are both effective and constitutional.
Poor residents deserve city governments that do not treat accountability as optional.
The worst bargain in urban politics is asking working-class residents to pay more while getting less.
## Corruption and Accountability Failures Are Not Theories
This article should not claim all current mayors are corrupt.
That would be unsupported.
The stronger and safer claim is that these cities have documented histories of corruption, local-government fraud, or accountability failures that damaged public trust.
Baltimore has direct mayoral corruption history. Former Mayor Catherine Pugh was sentenced in 2020 to three years in federal prison for fraud conspiracy and tax charges. DOJ said she was also ordered to pay $411,948 in restitution and forfeit $669,688.
Source: https://www.justice.gov/usao-md/pr/former-baltimore-mayor-catherine-pugh-sentenced-three-years-federal-prison-fraud
Detroit has one of the most notorious modern municipal corruption cases. DOJ said former Detroit Mayor Kwame Kilpatrick was sentenced to 28 years in federal prison for using his position as mayor and state representative to execute a racketeering conspiracy involving extortion, bribery, and fraud.
Source: https://www.justice.gov/usao-edmi/pr/former-detroit-mayor-kwame-kilpatrick-contractor-bobby-ferguson-and-bernard-kilpatrick
The FBI described Kilpatrick’s operation as a pay-to-play system involving extorted city vendors, rigged bids, and bribes.
Source: https://www.fbi.gov/news/stories/public-corruption-inside-the-kwame-kilpatrick-case1
Chicago’s record includes the federal conviction of former Alderman Edward Burke. DOJ said Burke was convicted on racketeering, bribery, and extortion charges for abusing public office to solicit and extort private legal work and other benefits from companies and individuals with business before the city.
Source: https://www.justice.gov/usao-ndil/pr/former-city-chicago-alderman-convicted-federal-racketeering-bribery-and-extortion
Philadelphia’s record includes the public-corruption convictions of John Dougherty and City Councilmember Robert Henon. DOJ said Henon received salary and other things of value from Dougherty and used his City Council position to serve Dougherty’s interests.
Source: https://www.justice.gov/usao-edpa/pr/local-98-leader-john-dougherty-philadelphia-city-councilmember-robert-henon-found
Kansas City’s case is smaller, but still relevant: six public works employees pleaded guilty in a $58,000 overtime fraud scheme.
Source: https://www.justice.gov/usao-wdmo/pr/six-kcmo-employees-plead-guilty-58000-overtime-pay-fraud-scheme
These cases are not identical.
Some are mayoral.
Some are legislative.
Some are administrative.
But they all point to the same problem: expensive governments with weak trust cannot ask residents for endless patience.
## Police Accountability Is Part of the Same Failure
High crime and weak police accountability can exist at the same time.
That is what makes the urban-governance problem so hard.
DOJ’s 2016 Baltimore findings said the Baltimore Police Department engaged in a pattern or practice violating the Constitution and federal anti-discrimination laws, including stops, searches, arrests without required justification, excessive force, and discriminatory enforcement strategies.
Source: https://www.justice.gov/archives/opa/pr/justice-department-announces-findings-investigation-baltimore-police-department
DOJ’s 2017 Chicago findings said there was reasonable cause to believe the Chicago Police Department engaged in a pattern or practice of using force, including deadly force, in violation of the Fourth Amendment, with systemic deficiencies in training and accountability.
Source: https://www.justice.gov/archives/opa/pr/justice-department-announces-findings-investigation-chicago-police-department
Memphis requires careful wording because the record changed.
In December 2024, DOJ announced findings that the Memphis Police Department and the City of Memphis engaged in a pattern or practice violating the Constitution and federal law, including excessive force, unlawful stops/searches/arrests, discriminatory enforcement, and unlawful discrimination in behavioral-health responses.
Source: https://www.justice.gov/archives/opa/pr/justice-department-finds-civil-rights-violations-memphis-police-department-and-city-memphis
In May 2025, a later DOJ leadership team said it would close several police investigations, including Memphis, and retract prior findings, criticizing the Biden-era investigations and consent-decree approach.
Source: https://www.justice.gov/opa/pr/us-department-justices-civil-rights-division-dismisses-biden-era-police-investigations-and
That means Memphis should be described as an accountability conflict, not as an uncontested settled finding.
The larger point stands: residents can be failed twice.
They can be exposed to violence and also lose confidence that policing systems are constitutional, transparent, and accountable.
## Kansas City’s Accountability Problem Is Especially Ugly
Kansas City lets Mayor Lucas have it both ways.
He is the mayor.
He is on the police board.
He is publicly associated with public-safety policy.
He is president of the Democratic Mayors Association.
His city announced that role by emphasizing Democratic mayors and crime reduction.
Source: https://www.kcmo.gov/Home/Components/News/News/2902/231
Yet when Kansas City’s crime record is judged against the national benchmark, the result is not impressive.
It is embarrassing.
Kansas City’s approximate 2025 violent-crime rate was about 1,342 per 100,000.
The FBI’s 2024 national violent-crime rate was 359.1 per 100,000.
Source: https://cde.ucr.cjis.gov/LATEST/resources/reports/UCR%20Summary%20of%20Reported%20Crimes%20in%20the%20Nation%202024.pdf
That means Kansas City’s 2025 violent-crime rate was roughly 3.7 times the FBI’s 2024 national rate.
Kansas City also carried an $8,800 taxpayer burden and needed $1.6 billion to cover bills according to Truth in Accounting.
Source: https://www.truthinaccounting.org/library/doclib/Financial-State-of-the-Cities-2025.pdf
TIA said rising unfunded pension liabilities increased long-term pension costs and put pressure on the city budget.
That is the bottom line for Lucas: he is not being judged by a cheap partisan insult.
He is being judged by outcomes.
A mayor who sells public safety nationally while his own city remains far above the national violent-crime rate should face hard questions.
A mayor who sits on the police board but operates in a state-controlled police structure should have to explain whether residents have real accountability or just political theater.
A mayor whose city carries a major taxpayer burden and pension pressure should not get to market governance as a success story without answering for the balance sheet.
Lucas may not control every lever.
But he owns the platform, the title, the messaging, and a seat at the table.
If he wants national credit for Democratic mayoral governance, Kansas City’s record has to be part of that conversation.
## What This Proves — and What It Does Not Prove
This evidence proves a defensible pattern: Kansas City, Memphis, Baltimore, Detroit, Chicago, and Philadelphia are Democratic-affiliated cities with high violent-crime rates compared with the national benchmark, long-term taxpayer-burden problems, pension or retiree-health pressures, poverty stress, and documented corruption or accountability failures.
It does not prove that mayoral race caused crime or debt.
It does not prove that every current mayor is corrupt.
It does not prove crime is rising in all six cities.
It does not prove Truth in Accounting’s taxpayer burden is an annual deficit.
It does not prove Kansas City’s mayor has full operational control over the police department.
Those limits do not weaken the article.
They protect it.
The facts are strong enough without overreach.
## Conclusion: Residents Are Paying More for Systems That Still Fail
The record shows a brutal bargain.
Residents in these cities live with violent-crime rates far above the national benchmark.
They carry long-term fiscal burdens from accumulated bills, pensions, and retiree-health obligations.
They deal with poverty and tax-base stress.
They watch corruption cases and accountability failures confirm public cynicism.
They are told to trust systems that often arrive late, cost too much, and explain too little.
Kansas City Mayor Quinton Lucas is the sharpest example because his national image now depends on the idea that Democratic mayors are delivering results.
But Kansas City’s record gives voters a different message: high violent crime, fiscal pressure, pension strain, city-government fraud in the federal record, and a police-governance structure that lets responsibility blur when residents need accountability most.
The facts do not say these cities are hopeless.
They say residents are paying too much for governments that still have not delivered safety, trust, or fiscal discipline.
And in Kansas City, they say Mayor Quinton Lucas’s national public-safety brand deserves much more scrutiny than applause.